coast-def
A model which simulates coastal flooding, and evaluated the economic benefits of climate adaptation strategies.
Finding Data Sources
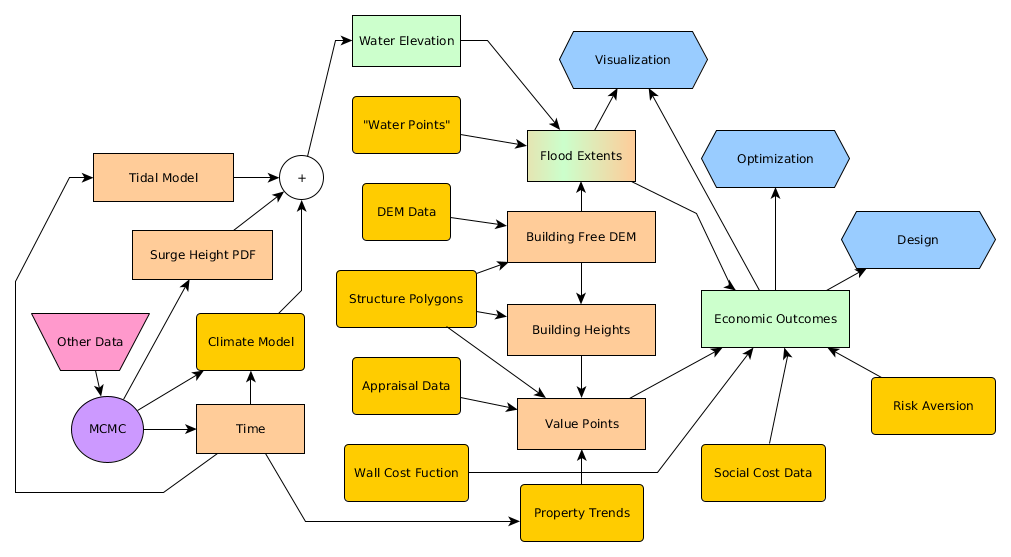
The flowchart below shows the CoastDef workflow. Everything in yellow is an oppertunity for a user to supply some type of data.
This guide is intended to help you find the data you need to get started modelling. It is incomplete, and will always be a work in progress. If you have suggestions about other potential data sources, please create a Github issue or email the project’s maintainers at coastdefproject@gmail.com.
Geospatial Data for the Model
DEM Data
CoastDef needs digital elevation data to simulate flooding conditions. That data must come in a GeoTIFF format; GeoTIFF can be opened by ordinary image views but contain special metadata about their geographic location. Each pixel represents an an x-y coordinate pair, while the “color” represents the elevation.1
There is free digital elevation data available for just about everywhere in the world. If you have access to it, Esri’s catalog has many raster lidar datasets to chose from, with a multitude of sources and resolutions.
However, most DEM data is created by governments, and is posted online for free. it just takes a little searching to find it. The website GIS Geography has a good primer on some of them.
For US-based analyses, one of the best DEM sources is the National Oceanic and Atmospheric Administration (NOAA) Data Access Viewer. In addition to their geospatial data collections, NOAA also hosts hundreds of other DEM datasets created by other organizations.
The Data Viewer has a host of tools that make getting the DEM you need easy. You can clip the data to the area you wish to analyze, change the units and projection reference, and fill in measurement holes in the lidar grid. You can also get “land” lidar data, which excludes pixels over water and buildings. Whether you want this last feature depends on your CoastDef data processing workflow.
The examples for this project were downloaded with NOAA’s Data Access Viewer, and were drawn from Connecticut’s 2016 Orthophotography and Lidar survey.
GeoTIFFs are not designed to be directly interpreted with human eyes, so don’t worry if you can’t see anything when you open it.
Water Points
“Water points” are data points which let CoastDef know where bodies of water are, a crucial feature of its flood extent algorithm. That algorithm, geo.flood_extent, finds marks pixels as underwater if and only if the are
- under the designated
surge_height - connected by a contiguous chain of other underwater pixels directly to a “water point”
The first criterion means that our water will not flood islands or pockets of land which are higher than the water level. The second criterion means that low-lying areas that are protected by higher land or structures will be safe until those protections are over-toped. This allows us to model walls and other landscape interventions easily; by changing a few DEM pixels along the intervention, we can predict new flood patterns behind it.
Unfortunately, you are going to have to create these points yourself in GIS software, most likely QGIS or ArcGIS. Our introductory guide to GIS can be found here.2 First, you will need to create a point-based shapefile. Next, you will use GIS to insert your waterpoints. Finally, you will save you changes and import your shapefile into CoastDef.
Valid water points must
- Be within the bounds of your DEM file’s geographic extent
- Be located on a permanent body of water
You can input as many water points as you like, and sometimes having multiple points is necessary to define all of your water locations.3 However, usually only one valid point is necessary, and extra points just slow CoastDef down.
Property Values
Property values data is very siloed, and the few people (Realtors) who have comprehensive databases guard them furiously. The best source of structural value data is your local appraiser; tax data is usually a mater of public record. Many jurisdictions also post GIS data files online; however, everyone’s format and schema are a bit different. If you want accurate results, you will probably have to invest some time and effort into acquiring, cleaning, and integrating data.
There are two notable national sources that would be particularly useful when modeling how housing values change over time. (The are too coarse to give good estimates about individual houses.) The first is Zillow, which has a tremendous amount of data about real estate transactions, which they make partially available to the public. The second is the Federal Housing Finance Agency’s House Price Index (HPI), a particularly valuable tool for including housing trends in your models.
Structure Outlines Data
To accomplish many tasks, CoastDef needs to know the locations of the buildings in your model. Structural location data is necessary to
- Find the values and locations of buildings
- Estimate what shape of the terrain with buildings removed. This in necessary because otherwise buildings would never be treated as “flooded” unless their roofs were fully submerged.
You can find data for both of these things directly, in which case building shapefiles are not necessary. If you do need them though, they are easy to find, particularly with the United States. Microsoft, for example, has used a ResNet machine learning system to extract building shapefiles for all 50 US states. You can download that data here.
Wall Data
This is another thing you have to make yourself with GIS. Your wall data should be formatted as polyline shapefiles, and they should follow the path of you proposed sea walls, berms, or gates. Each wall should have a “height” attribute; this will tell CoastDef how high to simulate your wall.4 You can also put data in other fields if you want to differentiate between your walls in another way.
Data for Probabilistic Modeling
Surge Height Distributions
One potential source of data for the surge heights is the NOAA SLOSH model, which has some of the most accurate storm surge predictions in the United States. Data derived from this model is incorporated into FEMA’s floodmaps. However, finding the raw data has proven to be difficult, and we have been unable to include SLOSH simulation results in our system.
Another approach is to try to learn a surge height probability density function (pdf) from water elevation data. We are currently in the processes of developing such a function.
Sea Level Rise
There is a lot of uncertainty extrapolated climate models, and we capture this uncertainty. CoastDef has built-in functions representing NOAA Global Mean Sea Level projections under multiple scenarios. There are also built-in functions adapting those models to the local circumstances in Connecticut. Your model can be a weighted mix of these models, or you can develop your own. You can even “train” your model on actual data using Bayesian inference.
Wall Costs
We have a reasonably robust basic wall cost formulation which you are welcome to use. However, it relies on empirical values which may not hold in your region or for your desired wall type. Developing a good wall function expression will require estimates of construction, eminent domain, and maintenance costs. Often, these values are matters of public record; you can also reach out to engineering firms back-of-the-envelope approximations. Infrastructure spending has a lot of uncertainty, and we are capable of representing construction cost variability in our modeling framework.
You will need to supply a function $ f(x)$ which gives the cost of the wall per linear unit, as a function of the elevation and wall height. CoastDef will then compute the total cost by solving the line integral
Where $x(t)$ and $y(t)$ are parameterized equations for the the wall. To have a constant cost per unit left, just ignore the height and elevation variables and use,
Most functional will have a constant component to represent eminent domain costs.
Damage Estimates
Our current approach assumes there is a linear relationship between the percentage of a building submerged and the damage to that building. This basic approach also seems to be used in FEMA’s damage evaluation process. Nevertheless, you are free to substitute your own non-linear function if you wish.
Risk Aversion
The risk aversion assumption of this model is that people are risk averse. Our current approach relies heavily on using data from decisions consumers make about flood insurance policies. From this data we have monetary values that individuals place on protection. This data can be found in various reports by economists and insurance companies published for given areas. From this data, we can calculate coefficient values. These values coefficients represent the amount that marginal benefit should be increased in order to accurately represent individuals’ preferences.
Social Costs of Flooding
Far to often, things that are difficult to measure just don’t get counted. This produces injustice and bad policy. One of the goals of our open-ended modeling structure is to encourage people to find new and creative ways to analyze the social, cultural, and political aspects of the human coastal ecosystem. This part of our standard model is still under development.
Footnotes
-
Confusingly, this third dimension often has a different scale, so you should check the metadata that comes with the file. ↩
-
This often happens when the connection between two submerged areas is cut off by the border of the DEM file. ↩
-
If you are a Python programmer you can also use the free and open-source GDAL for this. we used GDAL to program the geospatial components of our CoastDef. ↩
-
When developed, CoastDef’s wall height optimization feature will ignore this datum. ↩